About SPSS
SPSS is the acronym for Statistical Package for the Social Sciences. Though the name suggests a certain discipline of academics, it has found its foray into many different fields of study including but not limited to mathematics, statistics, engineering, humanities, economics and many others. It was developed way back in 1968 by C. Hadlai Hull and Norman H. Nie from IBM Corporation and to this day this software is owned and distributed by IBM. This application is compatible with both Windows and MAC operating systems, as well as UNIX and Linux. Besides different academic fields where SPSS is used, it has also found its place in several industries such as Telecommunications, Banking and Financial Services, Healthcare, Manufacturing, Retail, Government and Educational institutes.
Important Features of SPSS for dissertation data
SPSS is regarded as a data analysis tool capable of providing a comprehensive solution to statistical analysis of data collected from surveys or research by an individual for his or her dissertation work and it acts as a solution to flexible management of the data. It is a software application which is used to study survey data, mining and exploration of information, text analytics, statistical analysis, and for creating charts and graphs.
SPSS is a tool which comes with inbuilt features and functionalities and hence it is very easy to learn and use. It includes a full feature of data analysis from the loading of data, editing, analysis to graphical output and presentation features.
Entering Input Data required for the dissertation analysis
SPSS has a data editor which provides a very convenient interface to load data and browse through the dataset like an MS Excel spreadsheet. This editor gives the flexibility to the user to modify any data or add new data. Only one data editor file can be used at a time for conducting subsequent operations with the SPSS application on this data. The data editor of SPSS looks like Fig. 1.
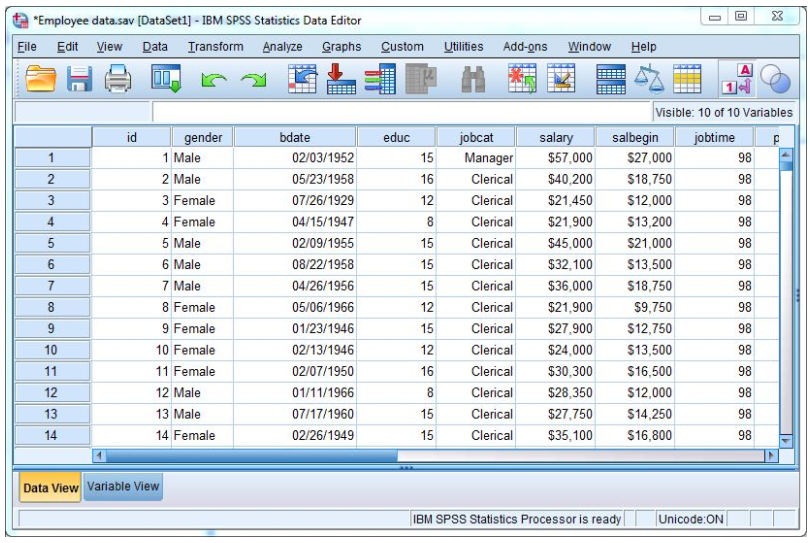
Fig. 1: Sample Data Editor of SPSS (adapted from Social Science Computing cooperative, ssc.wisc.edu)
A data file of SPSS is saved as a *.sav format, and the SPSS application will always ask to save the files while closing. This file format is not applicable for use by most other software. A data editor has two tabs – Data View and Variable View. The Data View tab provides a spreadsheet type look for the entire data that has been loaded, and the Variable View suggests the nature of the data under each header if it is nominal, ordinal, string or categorical.
Dissertation Data Analysis using SPSS
The first step in analysing any data using SPSS is to load the data. This could either be done by opening a saved .sav file, or opening a spreadsheet, reading from a database or text file, or simply by pasting the data in the data editor. Once the data is loaded and saved, it is ready for performing statistical analysis or simply for charting the data.
For running an analysis, the variables to be used should be chosen. A dialogue box opens which gives the user the option to choose the variable(s) to be used for analysis. Below figure gives a snapshot of the dialogue box for the frequency distribution of the selected variable(s).
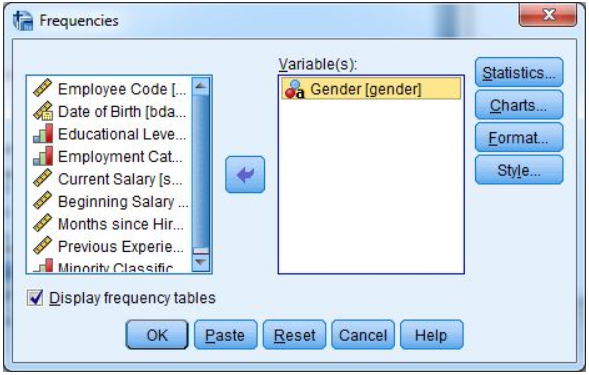
Fig. 2: Dialog Box for selecting variables (adapted from Social Science Computing cooperative, ssc.wisc.edu)
Once the data is loaded and the variables identified, a user is ready to analyse that data. There are several statistical procedures inbuilt as SPSS functionalities and are very easy to navigate just through the click of a button. Few prominently available procedures are Reports, Descriptive summary, comparisons of means and other statistical measures, Linear models (generalized, multiple, lognormal etc.), regression, correlation, classification models, data reduction, non-parametric tests, time-series analysis, survival methods, multiple response systems etc. among many others.
Graphs, charts and other visualizations that could be used in dissertation work
In addition to the statistical analysis performed by SPSS tool, it can also generate useful visualizations in the form of charts and graphs. Whereas, the visuals may not be very appealing and interactive, but these are useful in showing the results in graphical form. Some examples of the usual charts that can be created easily using this tool are Bar chart, line graph, area, pie chart, box plot, Pareto, control charts, normal P-P plots, normal Q-Q plots, sequence charts etc. These charts can easily and visually show the distribution and analysis results drawn from the data. However, there is certain restrictions and limitations to the customisation of charts and graphs and mostly come as standard outputs from this tool.
Output Viewer
As SPSS tool carries out various tasks and computations, the outputs are displayed in a variety of places. The new data is displayed in the data editor, whereas the results are shown in the output viewer. The outputs from the SPSS tool can be saved in an SPSS format as *.spv files. Figure 3 gives a glimpse of the output viewer for the descriptive summary of dummy data.
Fig. 3: SPSS Output Viewer (adapted from Social Science Computing cooperative, ssc.wisc.edu)
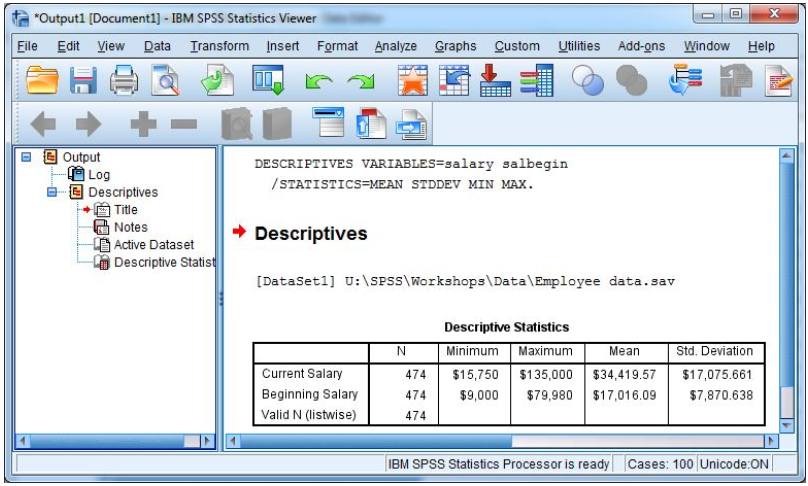
The output viewer will display data either in tabular format for the results or as graphs based on the analysis technique used. It will also display any error messages encountered during running the analysis.
Benefits and limitations of SPSS
SPSS offers a very user-friendly tool for carrying out statistical analysis of data. It is also a very popular tool and hence adequate documentation and user guides are available online. It also caters to a variety of data files to be easily loaded onto this tool and many other applications can read from the output files of SPSS.
SPSS is regarded as a primary statistical tool and hence in the academic world, it lags compared to other available applications such as SAS, R, MATLAB etc. which provides mathematical calculations and custom programming, as well as data mining. Its menu offerings are sometimes regarded as the most basic analysis options and therefore may result in inappropriate usage of certain analysis techniques. From a commercial point of view, it is an expensive tool and its licensing costs are not very user-friendly when compared to many other open-source applications currently available. Finally, another big drawback is the compatibility issues that a user may find while reading SPSS files created by its prior versions.
For more insights :