Background
The G8 countries in 2007 have decided to target and reduce the global emission by 50 percent by the year 2050 (Chevron, 2011). This threshold is set to allow developing countries to grow at a stable rate in the future, while Britain’s climate watchdog has suggested 80 percent cut in global emission by 2050. The Copenhagen summit of 2009 highlighted that greenhouse gas emission should start reducing by 3 percent if the 2050 threshold is set to be achieved.
To curb the current rise in greenhouse gas contribution from the domestic and commercial buildings, the emphasis on the use of geothermal energy resources is paramount. Recently, it was discovered that we can also get renewable energy from the earth. It was discovered that the temperature on the ground of the earth can reach 9,000 0F which can be used as a source of energy on the earth surface, referred to as geothermal energy (Alex Molinaroli, 2016). This energy resource has the potential to generate one-fifth of the UK power requirement (World Energy Org, 2016). Currently, these energy resources contribute only a tiny portion of the world energy demand (latest estimates put it at less than 1 percent of the world energy output). With a total capacity of 13.2 GW, around 315 MW of geothermal capacity was added in the year 2015. During the past decade, an investment of $20 billion was invested in geothermal energy by 49 developing as well as developed countries. However, geothermal energy production still needs to gain momentum which till date remains restricted due to high installation costs and relatively longer developmental periods compared to solar and wind energy production technologies.
Ground Source Heat Pumps
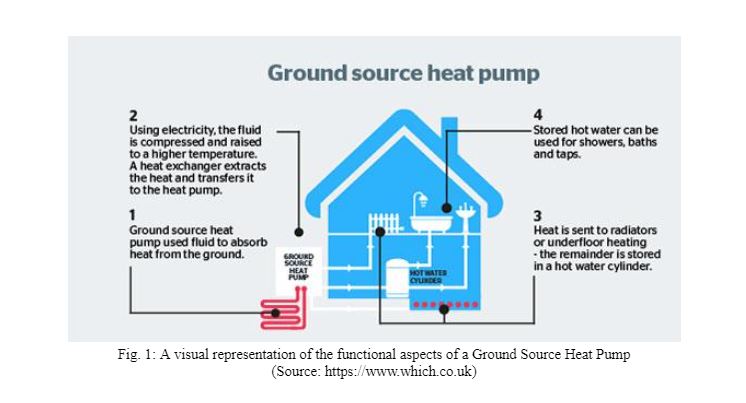
How it works!
A GSHP harnesses natural heat from underground by pumping water through pipes. The heat pump then increases the temperature, and the heat is used to provide home heating or hot water. The heat pump performs the same role as a boiler in a central heating system. But it uses ambient heat from the ground, rather than burning fuel to generate heat. It is typically made up of a ground loop (a network of water pipes buried underground) and a heat pump at ground level.
GSHP market – Global
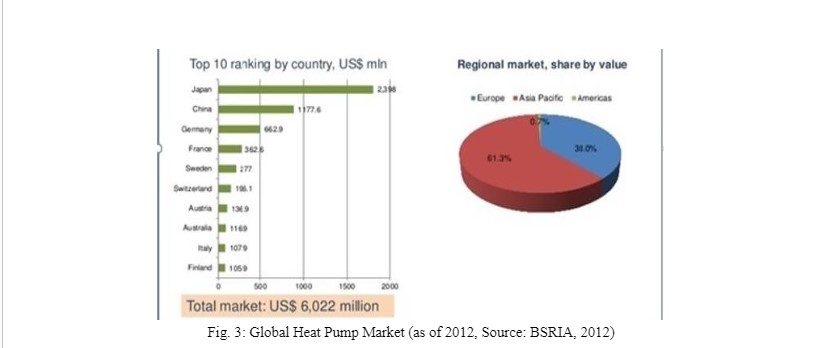
The world heat pump market is estimated at 6,022 USD in 2012, based on the top ten rankings. Japan and China are on the top list with 2,398 and 1,177 USD respectively while Italy and Finland are at the lower bottom of the ranking with 107 and 105.9 USD respectively. Others in the top ten ranking are Germany, France, Sweden, Switzerland, Austria, and Australia. Europe accounts for 38 percent of the market size, while Asia and Asia Pacific accounts for 61.3 and 0.7 percent respectively.
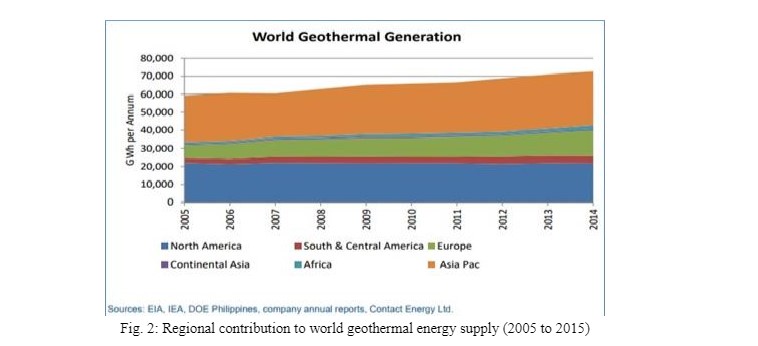
The installed geothermal capacity globally has reached over 70,000 GW while construction of over 11,766 GW is in the process in over 70 countries around the globe (U.S. Department of Energy, 2016). GSHPs have been proven to reduce energy consumption by 25 to 50%, low level of maintenance, high-efficiency levels and produce less noise during operation (Science Buddies Staff, 2017). The application of geothermal energy has covered residential, commercial and industrial sectors, the technology is now widely used in commercial buildings with a thermal storage system for heating and cooling the building. The market started with a small-scale power of 2.8 kW now reaching a maximum of 1,000 kw (Science Buddies Staff, 2017).
GSHP market – Europe
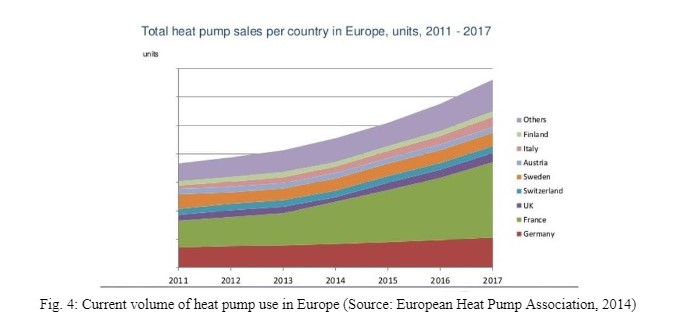
The below chart shows the rise in the number of heat pumps in Europe. It is evident from the graph that the rate of heat pump installation is increasing at a steady rate over the years. The growing demand for cost-effective and efficient conditioning system from both household and business is triggered due to the factors such as volatile oil price, reduction in the electricity bill, favorable incentives from the government and with the aim of reducing greenhouse emission for a better environment. Germany and France have the largest total heat pump in the region.
Market for GSHP in the UK
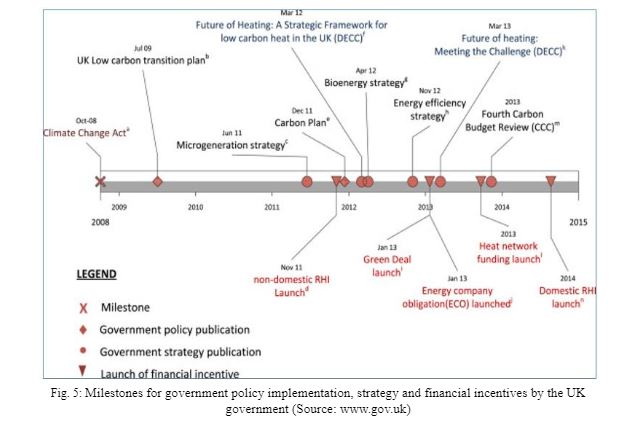
The milestones for government policies, strategies and financial incentives by the UK government are highlighted in Figure 5. The year 2008 serves as a milestone with the enactment of climate change act. In July 2009, the government came up with low carbon transaction plan while government strategy of microgeneration was launched in 2011 and the non-domestic RHI was launched in the same year. Government incentives include Green deal, Energy Company Obligation (ECO), heat network funding, and domestic RHI in the year 2013, 2014 and 2015 respectively while government strategies include bioenergy strategy, energy efficiency strategy, and future of heating: meeting the challenges, and fourth carbon budget review.
As of 2015, a total of 22,000 GSHPs have been installed in the UK, the installation is expected to reach 2,000 to 3,000 installations per year. The GSHP market is growing more in the UK than other countries that have the same climate with the UK such as Netherland and Denmark, as such this indicate more potential untapped in the UK in the GSHP market. Since the financial crisis of 2008 to 2010, the designers and installers of GSHP in the market have been relatively few, therefore the non-domestic market is modest, although there are large GSHP installations across the UK like Churchill hospital in Oxford with 280 boreholes heat exchange and Welsh assembly building in Cardiff. In the heat exchange technology, UK is currently leading the market most especially in energy pipes. It is forecasted that there is more than 10,000 energy installed pipes in the country among which, is the energy pile in London. The market development in the UK has been led by the activity of few major contractors and larger consulting firms like Arup.
An opportunity for potential investors is that the size of the market was valued at over 20 billion, and the demand for GSHP will be boosted due to the availability of shallow ground temperature and the reduction in energy consumption by 44 percent. The total insulation in the UK in 2015 have reached 22,000 while annual installation is expected to reach in the range of 2,000 to 3,000 indicating a deficit in the total insulations. A positive signal to potential investors is that the GSHP market is growing more in the UK than some other European countries. The total green deal plan in the UK as of August 2017 is 13,910 of which only 1,295 are completed. A total of 111 new plans were introduced at the same time thus reaching live plans at 12,481 and pending plans as 23. Out of the 1 million insulated homes target, there is a very wide gap between the properties insulated and those that are not. Due to the above facts and figures, we can conclude the market for GSHP in the UK is still at the rudimentary stage, and more investors and installers are needed into the market to meet the green deal target and the market is worth investing in.
GSHP Macro Environment – PEST Analysis
PEST Analysis is conducted to understand the macro environment for a product or a market. It also plays an important role in the market entry strategy of a new entrant. For the GSHP product and considering the UK macro environment, the following analysis has been drawn out.
Political
Alternative to the heavy reliance on conventional sources of energy such as Oil and Gas and the increasing political instability in the Middle East region
Government policies to curb global warming by reducing carbon gas emissions
The UK has nearly 30 different low carbon energy incentives in form of tax credits and subsidies
Economic
Lower GDP will have a depressing effect on renewable energy demand
Reduction in use and import of fossil fuels through the use of geothermal energy will improve GDP
Rising inflation over time tends to favor investment as higher returns will be accrued to factors of production
Social
Difficulties in obtaining planning permission - The reason for this is local NIMBY (Not-in-my backyard) opposition
The population of a region, its distribution, composition, growth, and trend over time are important social factors that play a key role in designing effective corporate strategies over a relatively long period of time
Impact on local biodiversity
Technological
Reliability of new technological advancements
Sustainable technological developments and affordable solutions for easy acceptance by consumers
Major international and domestic oil and gas players investing in alternative sources of energy through research and development
GSHP – SWOT Analysis
After drawing out the political, economic, social and technological factors of the GSHP product it is necessary to understand the strengths, weaknesses, opportunities, and threats, that this new product can pose. Hence a SWOT analysis is drawn out to understand about this product.
Strengths
Generate less CO2 than conventional heating systems
Cost savings from replacing other heating systems
Financial help from the Government can be availed – Renewable Heat Incentive Scheme for householders
Weaknesses
Installation costs are high and depend on the size of the system
Not suitable for properties with existing gas-fired central heating
May need a separate electric heater to help provide all heating and hot water needs
Take up significant facility ground space
Opportunities
An efficient way to heat a building - for every unit of electricity used by the pump, between two and four units of heat is produced
Cheaper electricity tariffs can be used to lower the cost of electricity to power the heat pump
Threats
A lack of good design while installation may result in poor performance of the GSHP
Impact on the ground ecosystem may disrupt natural habitat
More developed technologies available
Market Entry Strategy for a new entrant
It is very important for a new entrant of a market to gauge the various nuisances that a market may pose for the offered product. Hence, it is imperative to draw out the right strategies to evaluate the market, understand the customer, target the right audience and position the product.
Porter’s 5 forces model of competitive position
Threat of New Entrants – Low
Availability of different incentives in terms of tax credit and subsidies will definitely woo potential investors to invest in the UK
Injection of huge capital at start-up by new companies, with right management team and dedicated staff, could neutralise the retaliation power of the existing competitor
Industry Rivalry – High
UK energy industry is dominated by many multinational energy companies
Fierce competition between industry players because of the global interest in reducing global warming and carbon emission through low carbon energy sources
Renewable energy is a fast-growing sector of the energy industry in the UK
Threat of substitute products – High
Renewable energy sources are generally more expensive than conventional energy sources
High Installation costs and space requirements of GSHP compared to boilers, air heat pumps etc.
Conventional energy sources
Bargaining power of suppliers – High
Very few suppliers currently in the UK market
Bargaining Power of Customers – Low
Customers do not have many options to choose from for GSHP and therefore cannot influence pricing decisions
Michael Porter’s generic strategies
We use Porter’s generic strategies framework to evaluate an appropriate strategy for this product and the competitive advantage that can be obtained
Cost Leadership:
This strategy is about providing low-cost product to the customers. GSHP market is new and evolving with high set up costs of plant and less number of competitors in the market. Hence a low-cost strategy will be detrimental to a new entrant in this sector
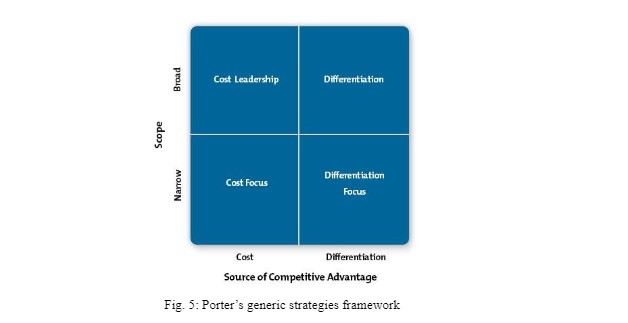
Differentiation:
Differentiation strategy is about providing an innovative product to the customer. This strategy is most suitable for first movers in a sector. As GSHPs are an established product hence unless a new entrant provides a new and innovative product, this strategy is not recommended.
Focus:
This is a recommended strategy for a new entrant in the space of Ground Source Heat Pumps as a new entrant cannot afford a cost leadership due to high set up costs nor a differentiation strategy for a standard product. Thus, any new entrant in this sector should target a niche market to start with. It is also recommended to adopt only one approach in order to gain a competitive advantage
Market Segmentation
The UK market is primarily segregated into six major regions – Southwest, London and Southeast, Yorkshire and Humber, East of England, Scotland and Scottish Islands. The market dynamics for each of this region for the GSHP product is different from each other as shown below:
The Southwest region
A high level of visibility of this technology is prevalent in the domestic sector of this region. This region is called the “green peninsula” due to significant coverage of renewable technologies in this area. This is also because many areas have limited access to the gas network.
London and the Southeast region
A hotspot for commercial-scale systems, the region around central London attracts a lot of focus for this technology. The Merton rule is the primary driver for this, as it has been existent there for the longest period.
Yorkshire and Humber
Heat pumps in this region account for almost 10% of all LCBP funding, equivalent to approx. £2m. These places were one of the biggest areas for grant awards. Harrogate and Don caster in Yorkshire are actively using GSPs in housing association schemes.
East of England
Norfolk area is highlighted in this part of UK as a potential area due to its limited access to mains gas.
Scotland
Due to a superior funding scheme for GSP technology, “the SCHRI was identified as a good stimulus to the market” by the GSHPA and more effective than equivalent English funding schemes in stimulating the market (Environment Agency, 2009).
Scottish Islands
These islands have good potential for GSHP systems due to their inaccessibility to the mains gas system.
Financial Analysis
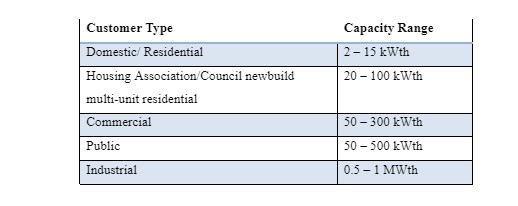
Target Segment
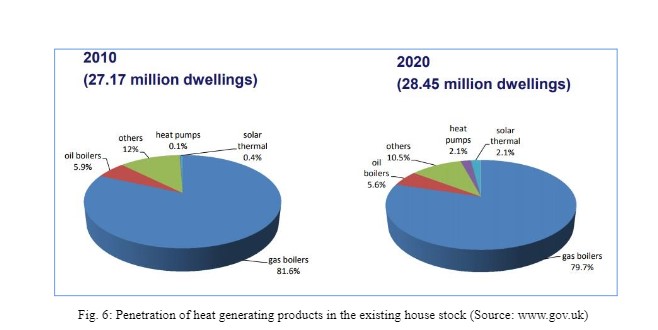
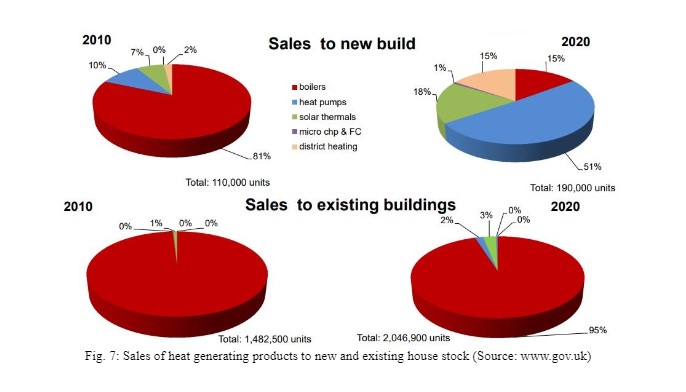
Domestic buildings and residential associations with low heating requirements form the target segment for this analysis. Their average heating capacity requirement is 15kWth. Figure 6 suggested that the increase in the number of dwellings from 2010 till 2020 will be 0.28 million, that is at an annual average increase of 28,000. The sales figures in Figure 7 shows that only 50% of the new dwellings could be targeted for heat pumps. Therefore, the market for all types of heat pumps for new dwellings come at 14,000. The share of GSHP among different categories of heat pumps is around 50%, which arrives a GSHP target segment of 7,000. This is the target base for new dwellings for all players of GSHPs in the market. A new entrant can take a conservative target of achieving 10% market share which will suggest a customer base of 700 new dwellings.
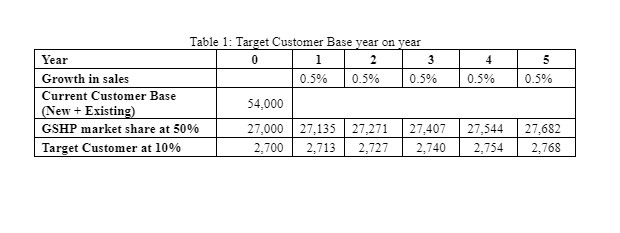
In case of existing buildings, heat pumps could penetrate only 2% by replacing the gas boiler option as shown in Figure 7. This gives a customer base of 40,000 for all types of heat pumps. Hence, the target segment for GSHPs becomes 20,000 considering a share of 50% among heat pumps. A new entrant can take a conservative target of achieving 10% market share which will suggest a customer base of 2,000 existing dwellings. Thus, the starting customer base for a new entrant considering both existing and new customers is 2,700. Considering a growth target of 0.5% year-on-year, the target customer base then can be shown in the below table:
Financial Parameters
The financial parameters required for carrying the cost analysis for this project is shown in the below table.
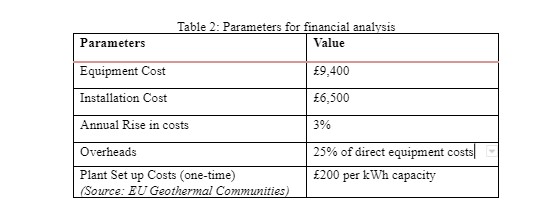
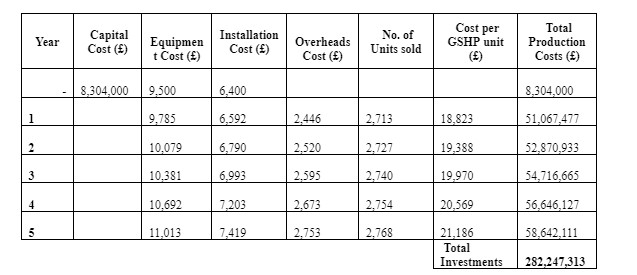
Considering an average capacity requirement of 15 kWth for each domestic customer, the initial set up costs is an estimate based on the volume of target customers in year 5 to be 2,768 at £8.3 million.
NPV Analysis
To perform the Net Present Value Analysis, a discount factor of 5%, and a markup profit of 5% are assumed. The below table shows the output of the analysis. The Net Profit to be realized at the end of 5 years is estimated over £3.5 million, with a breakeven of around 2750 units.
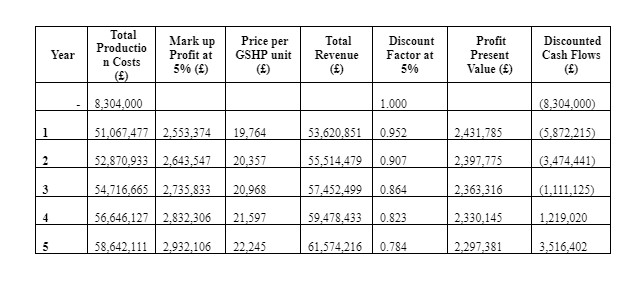
Payback period
The NPV Analysis output table shows that the cash flows turn positive after the 3rd year. To estimate the accurate payback period, we should divide the absolute value of the negative cash flow in the previous year and the total cash flows realized in the year when the cumulative cash flows turn positive. Therefore,
Payback period = 3 + (|-1,111,125| ÷ 2,330,145) = 3.48 years
Summary
The Net Present Value of the investment, breakeven volume and Payback period are summarized in the below table:
Recommendations
High installation costs and lower target customer base makes this an unattractive product segment for investment by new entrants. Therefore, a focused differential strategy targeting a specific segment of domestic customers is recommended.
A higher profit margin of over 5% if achieved could result in quicker revenue recognition, turning a positive cash flow in a short span of time and therefore reducing the payback period.
If a new entrant has to invest in this sector, the objective should be to implement economies of scale, in the long run, to reduce production costs while maintaining margins
Aggressive sales and marketing needed to increase sales figure, to convince the existing dwelling owners, and to gain market share for the new customer's segment.
Continuous research and development of the product are suggested to stay ahead of the curve in the ever-changing market dynamics.
References
Alex Molinaroli (2016) From Paris to Dubai, How Can Cities be more Sustainable? He is participating in the World Economic Forum’s Annual Meeting in Davos. Chairman, President and CEO, Johnson Controls
Amis T and Loveridge F. (2014). Energy Piles and other Thermal Foundations for GSHP. REHVA Journal
Antics, M., Bertani, R. & Sanner, B. (2013): Summary of EGC 2013 Country Update Reports on Geothermal Energy in Europe. - Proc. EGC 2013, paper keynote-1, 18 p., Pisa
Bloomquist, R. Gordon, M (2009). Geothermal Heat Pumps, Four plus Decades of Experience, 2009
CCC, (2013a). Fourth Carbon Budget Review-part 2: The Cost-Effective Path to the 2050 Target. Committee on Climate Change. [Online] Available at: http://www.theccc.org.uk/wp-content/uploads/2013/12/1785a-CCC_AdviceRep_Singles_1.pdf [Accessed: December 17, 2017].
CCC, (2013c). Meeting Carbon Budgets-2013 Progress Report to Parliament. Committee on Climate Change. [Online] Available at: http://www.theccc.org.uk/wp-content/uploads/2013/06/CCC-Prog-Rep-Book_singles_web_1.pdf [Accessed: December 17, 2017].
Chevron (2011). Geothermal: Harnessing Renewable Energy for Power Generation. [Online] Available at: http://www.chevron.com/deliveringenergy/geothermal/. [Accessed: November 25, 2017].
Conti P., Cei M., Razzano F., (2015) Geothermal Energy Use, Country Update for Italy - Proc. EGC 2016, Strasbourg
DECC, (2012d). The Energy Efficiency Strategy: The Energy Efficiency Opportunity in the UK. UK Department of Energy and Climate change.
DECC, (2013a). Domestic Renewable Heat Incentive: The First Step to Transforming the Way We Heat Our Homes. UK Department of Energy and Climate Change.
DECC, (2013b). The Future of Heating: Meeting the Challenge. UK Department of Energy and Climate Change.
DECC, (2013c). The Future of Heating: Meeting the challenge, Evidence Annex. UK Department of Energy and Climate Change.
DECC, (2013d). Micro generation Strategy Industry Action Plan. UK Department of Energy and Climate Change.
DECC, (2013g). Non-Domestic Renewable Heat Incentive (RHI). UK Department of Energy and Climate Change.
DECC, (2014). Heat Networks Delivery Unit. UK Department of Energy and Climate Change.
Dexheimer, R. Donald, (1985). Water-Source Heat Pump Handbook. National Water Well Association. Worthington, OH.
HM Government, (2009). The UK Low Carbon Transition Plan.
Jones, C; Kammen, D (2011). Quantifying Carbon Footprint Reduction Opportunities for U.S. Households and Communities. Environmental Science & Technology. 45 (9): 4088–4095.
Science Buddies Staff. (2017). The Power of Heat Is Right Under Your Feet!
Science Clarified. (2008). Geyser and Hot Spring.
The Geothermal Education Office. (2008). Facts and Information [Online] Available at: http://geothermaleducation.org/ [Accessed: December 7, 2017].
Wright, L.; Kemp, S.; Williams, I. (2011). Carbon foot printing': towards a universally accepted definition. Carbon Management. 2 (1): 61–72.